Thursday 30 June 2022

How to migrate to Google Analytics 4: A step-by-step guide

You’ve likely heard by now that Google is updating Google Analytics from Universal Analytics (also known as GA3 or UA) to a new, upgraded version, Google Analytics 4 (GA4). 

The migration for many of us from GA2 (Classic Analytics) to GA3 (Universal Analytics) was relatively painless 10 years ago.

This migration isn’t quite as simple. 

There are many differences between the current Google Analytics you’re likely using (UA) and the new version of Google Analytics (GA4), and not all of the features of UA are present in GA4. 

Additionally, Google is pressing us to update now. As of July 1, 2023, the free version of Google UA will no longer collect data. 

That means that you need to seriously address your analytics plan as soon as possible to ensure that as of that date that your new GA4 property is tracking correctly and can provide you with accurate year-over-year data.

Here’s how to migrate to Google Analytics 4.

Phase 1: Create your GA4 property and launch it

Of utmost importance is creating your new GA4 properties and launching them immediately. 

Properties won’t be importing historical data from UA, which means that your GA4 property will only start tracking traffic data from the moment you create it and forward. 

So the sooner you create it, the sooner you’ll have data populating in the GA4 property.

Timeline: Ideally, this should be done before July 1, 2022. But if you miss this date goal, just create your GA4 property (or properties) as soon as possible.

To launch the new property, you’ll need to:

  • Create the new GA4 property.
  • Add the new GA4 tracking tag to your site. 

This is most easily accomplished if you use Google Tag Manager. After deployment, check the new property over the next few days to ensure you’re seeing traffic data populating in the property.

Phase 2: Make a list of your key items

New analytics properties do not inherit specific tracking items (e.g., goals, events) from any other properties (including UA properties). 

The following is a list of the most common tracking items I use in Google Analytics. You may have additional ones to add, but these are some common ones you need to add to the list:

  • Events
  • Goals (Conversions)
  • Content Groupings
  • Custom Dimensions/Metrics
  • Referral Exclusions
  • Product Link Connections
  • Audiences

Once you’ve created your list, evaluate what you need to keep, which you can discard, and also perhaps where gaps might exist where you may want to create new tracking items, such as new events, new goals, etc.

Remember that goals are created in each reporting view. Reporting views are not used with GA4, so if you want to preserve all of the goals you currently have in multiple reporting views for the same UA property, then you’ll need to list all of them and recreate them in the GA4 property. 

Like UA reporting views, which limited you to 20 goals per reporting view, GA4 limits you to 30 conversions per property

When you list out your current goals, be sure to note which ones are “non-event” goals (for example, destination-based goals), as you’ll need to make some changes to how you track those going forward.

Phase 3: Begin migrating individual items to GA4

Once you have your list of items to recreate in GA4, the real setup work begins!

Here are the most common items for set up and some tips for setting each one up:

Events

Events in GA4 are similar to UA setup, but you may need to set the tagging up anew for GA4 goals.

Some events you may have manually set up in the past, like scroll depth, are now automatically added for you in GA4.

So first, check the automated goals that are tracking in your GA4 property by looking at the events under Configure in the navigation. No need to recreate events that Google has already created for you!

Like with adding the general GA tracking code to your site, Google Tag Manager is the easiest tool to use for this effort.

Goals (Conversions)

In GA4, goals are now renamed “Conversions”, and all goals are event-based.

When migrating your existing UA goals to GA4, I suggest starting with the event-based goals, as those are more similar to the original goal set up in UA.

Once you’ve set up the events in GA4 and marked them as conversions, start with destination-based goals and engagement goals.

Content Groupings

In UA, content groupings were created in the interface itself. However, in GA4 there is no interface setup – all content groups are created through page tagging.

In some ways, this is a nice change, but it requires a lot of time investment at the onset.

A page can have multiple “gtags” on it, and the simplest way to implement these will likely be Google Tag Manager.

If you wish to implement content groupings in GA4, visit this reference guide from Google.

Custom Dimensions/Metrics

Like with UA, setting up custom dimensions and metrics is a two-step process – it requires set up in both the interface and the code.

Your existing UA custom dimensions and metrics tags may migrate over fine to GA4, but you will still need to set up the dimensions and metrics in the GA4 property interface.

To set up custom dimensions and metrics in the interface, refer to Google’s setup guide.

Referral Exclusions

Referral exclusions still exist in GA4, but they’ve essentially been renamed and moved a few layers down from the top admin navigation levels.

To add referral exclusions, under your GA4 property admin menu, select Data Streams, then your site data stream (your URL), then select More Tagging Settings under the Additional Settings section.

Finally, click Configure Your Domains and enter your domain and any other domains (such as those from third-party apps that integrate with your website, like certain marketing automation tools).

You’ll need to reconnect your Google products’ links to your new GA4 property. Note that it’s OK to have your Google properties connected to multiple GA properties, so you don’t need to remove your existing UA product links to connect GA4 too.

Product Links now appear at the top level of the property admin navigation. Select each of the Google products you use, like Google Ads, and connect your new GA4 property(ies).

Audiences

Google Analytics audiences are helpful for advertising purposes and now also conversion setup in GA4. It’s important to set up your audiences long before July 1, 2023 so that you can update your Google Ads campaigns with comparable, viable audience lists when the UA properties stop tracking. 

To recreate your audiences in GA4, first focus on the audiences in your list in UA (at the property level) and look for those that have Google Analytics as the audience type. Those will need to be recreated in GA4.

However, the terminology and way you create audiences has changed in GA4, so refer to Google’s audience creation guide for assistance.

Ecommerce

Like almost all things in the UA to GA4 migration, ecommerce tracking also won’t magically move from UA to GA4. Google recommends creating a separate set of tags for GA4 ecommerce tracking, even though it is the same as UA.

Here again, Google Tag Manager is likely the easiest and fastest way to implement your ecommerce tagging across the site.

For detailed information for ecommerce migration, visit Google’s GA4 ecommerce migration guide.

Timeline: Because these items will only start tracking when they are created, ideally the tracking items above should be implemented before July 1, 2022. However, if you can’t complete them all before July 1, 2022, just complete them as quickly as you can.

Phase 4: Check your items

Once you’ve launched your tracking items in the new GA4 properties, you’ll need to double-check that they are tracking properly. 

Evaluate your ecommerce, conversions, event tracking and more to ensure they are tracking as expected in the new properties. If not, troubleshoot the issue and fix it as soon as you can.

Phase 5: Determine a date for migrating to GA4 as your single source of truth

Organizations rely on Google Analytics for reporting for many departments, so it’s important that the organization agree to when the new GA4 property(ies) will become the “single source of truth” for data and reporting. 

In best practice, you should likely wait until you have year-over-year data in your GA4 property(ies) prior to changing your single source of truth to GA4 in part because the metrics and tracking in GA4 are completely different than they are in UA, ergo you cannot accurately use UA data from one year and compare to GA4 data in another year.

If you can get your new GA4 implemented prior to July 1, 2022, then you can likely start using it as your single source of truth as of July 1, 2023.

Regardless, if you use the free version of Google Analytics, you’ll be forced to migrate to GA4 as your primary source of truth on July 1, 2023, even if the year-over-year data with UA isn’t comparable.

Phase 6: Archive your UA data

To add insult to injury, Google decided that in addition to forcing us all to migrate to GA4 now that they will also delete all of our historical UA data beginning on January 1, 2024. 

While you do have a bit more time to archive this data, you should plan on archiving in case you need to reference it in the future. 

First, determine what data you regularly need. For example, I often use the source/medium report. 

Then consider the intervals in which you access this data. Typically, I access data on a monthly basis, such as June 1-30. You’ll want to archive your data in a manner that matches these data usage habits.

I personally find the UA interface clunky for archiving purposes. In my example of the source/medium report and pulling monthly data, in the interface, you can only pull two months of data at a time (one as the original month and one as the comparison month), then download the data to CSV. That will take forever! 

Instead, especially if you’re not a developer who knows how to use the Google Analytics API, consider using the Google Analytics Spreadsheet Add-On, which works with Google Sheets. It’s super handy and pulls that data fast! 

Just be sure you don’t run into data sampling issues, and if you do, take smaller reports. 

For example, if I pull 10 years of data from the source/medium report broken down by month, it may be so much data that it forces Google to sample the data. If that’s the case, I would try breaking it down into several report pulls, perhaps one year’s worth of data per report. You can always combine the data into one sheet once it’s pulled.

Timeline: If you are using the free version of UA, you will need to do this between July 1-December 31, 2022. Your data will be deleted on January 1, 2023. If you are using UA 360, you must archive your data before June 30, 2023.

Finally, don’t panic!

I know, it’s all stressful. Hang in there. It’s going to be OK. 

I speak on this subject around the country, and recently someone asked me if there’s anything good about GA4.

The answer is a resounding yes

GA4 is aiming to get us all closer to true ROI and cross-device reporting. 

However, growth and change are difficult. We humans don’t tend to enjoy it. 

But it truly will all be OK. Just prioritize this now, and if you need my help, please reach out. Data is my passion, and I want yours to be accurate! You can reach me at jmiller@marketing-mojo.com.

What you need to know about adopting Google Analytics 4

Want to watch my SMX Advanced session, which explored the differences between GA4 and Universal Google Analytics? You can watch it on-demand.

The post How to migrate to Google Analytics 4: A step-by-step guide appeared first on Search Engine Land.


from Search Engine Land https://ift.tt/bAY968w
via
Google documents how to inject canonical tags using JavaScript

Google has updated its JavaScript SEO help document to add technical details on how to inject canonical link tags using JavaScript. Google added a new section titled “properly inject rel=”canonical” link tag.”

What is new. Here is the new section where Google recommends not to implement your canonical tags using JavaScript, but if you must, Google explains this is the proper way to do so. Google wrote:

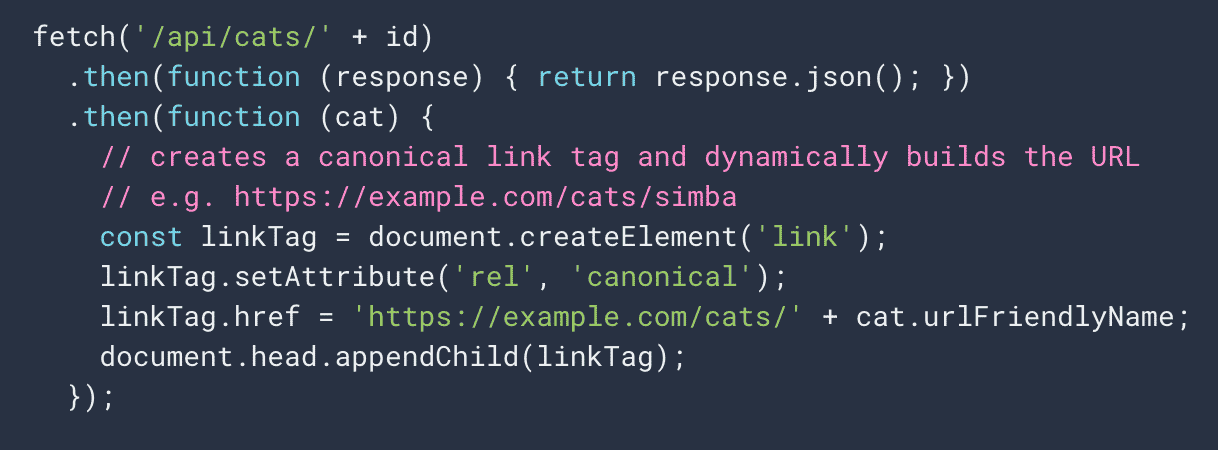
While we don’t recommend using JavaScript for this, it is possible to inject a rel=”canonical” link tag with JavaScript. Google Search will pick up the injected canonical URL when rendering the page. Here is an example to inject a rel=”canonical” link tag with JavaScript:

Google added this warning stating “When using JavaScript to inject the rel=”canonical” link tag, make sure that this is the only rel=”canonical” link tag on the page. Incorrect implementations might create multiple rel=”canonical” link tag or change an existing rel=”canonical” link tag. Conflicting or multiple rel=”canonical” link tags may lead to unexpected results.”

Hit or miss. We have seen cases where Google can pick up these canonical tags or other embedded elements, even structured data, using JavaScript. But it can be hit or miss, so it is recommended that if you are going to use JavaScript specifically to inject your canonical tags, follow these directions precisely.

Why we care. Again, if you are injecting canonical tags using JavaScript, Google has finally officially documented the proper way to implement it. So check the documentation over here and make sure your implementation follows Google’s recommendations.

The post Google documents how to inject canonical tags using JavaScript appeared first on Search Engine Land.


from Search Engine Land https://ift.tt/qNwIt18
via

11 Google Sheets formulas SEOs should know

Sometimes the best SEO tools are free.

Look no further than Google Sheets.

While it’s not great at plotting ranking data (inverting the y-axis is always ugly), there are numerous ways to use Google Sheets for SEO.

Here are 11 of the formulas and tips I find myself using for SEO on an almost daily basis – for keyword management, internationalization, content/URL management and dashboards.


Get the daily newsletter search marketers rely on.

Processing...Please wait.


Google Sheets formulas for keyword management 

  • V LOOKUP
  • CONCATENATE
  • FLATTEN
  • LOWER

=VLOOKUP(text,[range to search],[column number to return],[true/false]) 

V LOOKUP (documentation)

VLOOKUP, which stands for “vertical lookup”, is arguably one of the very first Google Sheet formulas for SEO anyone learns when getting into the game.

VLOOKUP allows you to essentially combine two data sets on common values, an almost lowbrow JOIN in SQL if you will.

I generally use this formula to enrich information about keyword sets by adding search volume, PPC data or adding downstream metrics like signups. 

The end directive true/false specifies how exact you want the match to be, TRUE means not an exact match, and FALSE means exact matches only.

Tip: LOCK the range you’re searching against using $ ($E$3:$E$5 in the below example) so you can drag and carry the same formula across many rows.

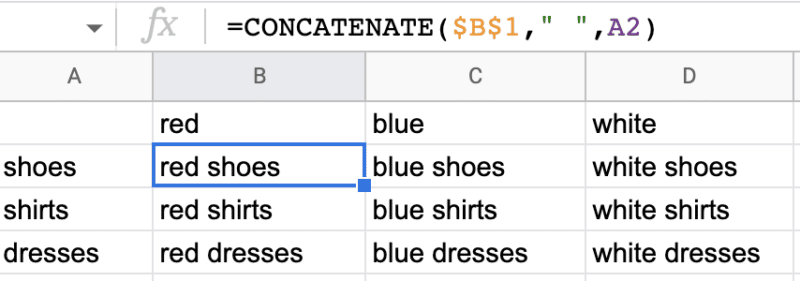
=CONCATENATE(A1,A2,A3) 

CONCATENATE (documentation)

  • =CONCATENATE(A1,A2,A3) you have the option to concatenate columns
  • =CONCATENATE(A1,” I’m additional text”) or literal words and characters

Concatenate is one of the most commonly used Google Sheet formulas in SEO, and for good reason.

It can serve a variety of use cases, including creating keyword lists (concatenating two+ variables together), creating URL strings, or even bulk templatizing metadata.

As the name suggests, you can use it to simply string any amount of values together.

Just remember: if you need a space between keywords, a literal space “ “ must be added.

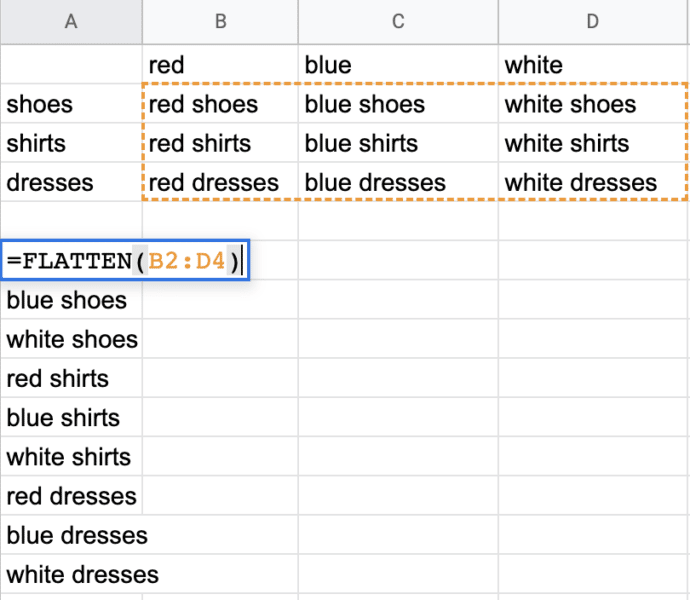
=FLATTEN(range1, [range2, …]) 

FLATTEN (documentation)

  • =FLATTEN(A:D) would compress all ranges in A – D in to one column

There’s a reason FLATTEN is coming after concatenate. After you’ve concatenated several thousands of keywords and a couple of hundred dollars away, you generally need to upload the keywords into your rank tracking tool’s UI or via a CSV bulk upload.

It can be tedious when you have a 20×20 block of keywords to get them into a single column so you can upload all your keywords in one go.

With FLATTEN, you essentially select the range of data you want and the output is all of your keywords in one column to make copy-pasting a dream!

=LOWER(text) 

LOWER (documentation)

This one’s pretty simple – but it can be helpful to LOWERcase all the of the keywords you’re managing (especially if you use a service provider that charges for things like duplicates) or if you’re in a case-sensitive environment like SQL.

LOWER is admittedly one of the simplest Google Sheets formulas for SEO.

The opposite (UPPER) also works, should you feel like auto-capping everything. 

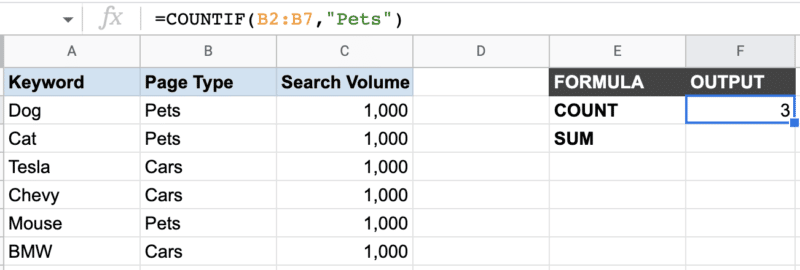
=COUNTIF(range,”[text or function]”) 

COUNTIF (documentation)

COUNTIF lets you count, with accuracy, any literal text you want to match or even some numerical values that meet conditional rules.

It’s particularly useful when grouping together pages, managing an upcoming content calendar or sorting keywords on common dimensions like the page type or product they support.

It can also be used with conditions to match values, such as ones that have CPCs > $10.00 or that have a search volume > 100 searches a month. 

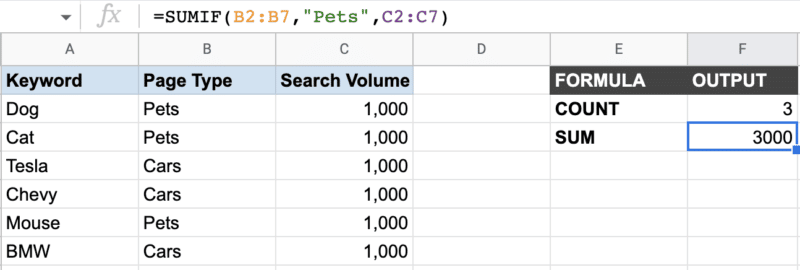
=SUMIF([range to search],”[condition to match]”,[range to return]) 

SUMIF (documentation)

SUMIF is similar to COUNTIF, but is helpful if you’re trying to add up an additional metric associated with the group of interest, like summing up total keyword volume opportunities by themes or search volume by page type. 

Google Sheets formulas for internationalization

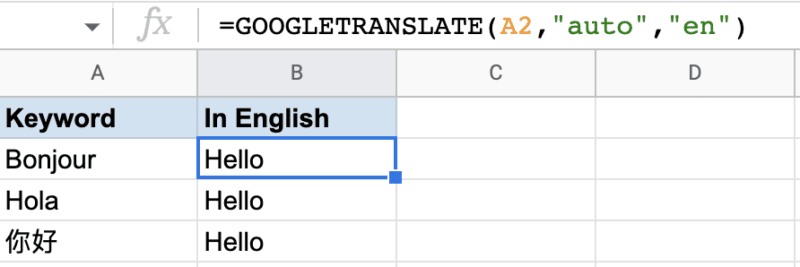
=GOOGLETRANSLATE(text, [“source_language” or “auto”, “target_language”])

GOOGLE TRANSLATE (documentation)

  • source_language = two-letter language code of the source language (or “auto” for Google to guess)
  • target_language = two-letter* language code for your target language, like ES for Spanish

Ahh, one of my favorite and most loved Google Sheets hacks.

Rather than go back and forth to the Google Translate UI and risk carpal tunnel, you can bulk translate lists of keywords in seconds into one, or even multiple languages.

You even have the option to auto-select the origin language by changing source_language to “auto” to let G sheets choose for you (which usually works, usually).

Google doesn’t support translating into all “flavors” of languages (e.g., Canadian French), but supports languages like pt-pt and pt-br, as well as Chinese languages like zh-tw and zh-cn.

Google Sheets formulas for content/URL management

=SPLIT(text,[delimiter wrapped in “”])

SPLIT  (documentation)

Many times when you’re doing an analysis you might be working with data that is not in the required format you need.

There might be extraneous information that is separated (delimited) by things like commas (addresses), phone numbers (parenthesis and hyphens) and more.

While there’s a “split text to columns function” in the toolbar under “Data”, you can also split text that is delimited by a specific character, word or even spaces to individual columns with the SPLIT command directly in the sheet so you can quickly trim and tidy your keyword list.

=LEN(text) 

LEN  (documentation)

LEN is a simple Google Sheets formula for SEO you can use to simply count the characters in a line or string.

It can be most helpful when guiding people (both SEOs and non-SEOs) who are writing their own metadata, to stay within a “safe” enough character count so that it will hopefully not get truncated simply due to length.

=REGEXREPLACE(text, “regular_expression”, “replacement”)

REGEXREPLACE  (documentation)

Regexes are a powerful data mining tool when working on large websites.

If you’ve never even heard of regexes, you’ve probably not yet been challenged with an enterprise-level site.

I find myself using REGEXREPLACE most often when I’m cleaning up or trimming URLs in a sheet, where it can be helpful when I only need a path name minus domain or to manage redirects.

Google Sheets formula for dashboards

=SPARKLINE(B3:G3)

SPARKLINE  (documentation)

  • =SPARKLINE(B3:G3,{“charttype”,”line”; “color”,”indigo”; “linewidth”,2}) this version of sparkline is in indigo, with a slightly heavier weight

While BI tools like Tableau and Looker offer additional customizations, Google Sheets can be a cheap way to build simple dashboards.

The command SPARKLINE is capable of leveraging data to create simple visualizations in a Google Sheet.

A good amount of SEO and web data looks great on a time series, and Google Sheets can make it easy.

This is most helpful when you have data that is being actively updated inside of Google Sheets and need to skim 10+ trends quickly in one sheet.

A popular use case is to monitor trends like growth in several countries, campaigns or city-level basis. 

=SPARKLINE(B3:G3,{“charttype”,”line”; “color”,”[color you want]”; “linewidth”,2})

Time series/line charts

Time series is probably the most helpful for visualizing changes to traffic patterns over time and is suitable for monitoring most traffic trends and north star goals.

You can also remove the “line width” command, weight and even color for a quick and easy graph, but I find for time series I always need the line to be a little bolder and the contrasting color helps draw attention to the graph.

Column charts and bar charts
Sparkline even supports column and bar charts! Just change the chart type to column (shown below) or bar.

In more advanced use cases, most of the formulas above can be manipulated to have enhanced outputs, like automated conditional formatting or fun Unicode emoticon responses instead of nulls.

No matter how advanced you make them, using these formulas inside of Google Sheets is a great and cheap way to do basic SEO tidying work and keyword research.

The post 11 Google Sheets formulas SEOs should know appeared first on Search Engine Land.


from Search Engine Land https://ift.tt/Mi6oclE
via

Forecasting web traffic using Google Analytics and Facebook Prophet

Ready to learn a quick-and-easy way to get traffic predictions for any amount of time in the future?
Seriously.

This article will show you how you can:

  • Predict traffic changes, and maybe even let your boss know when periods of stagnation or negative growth are to be expected.
  • What to expect during times of increased or decreased traffic, so you could tell if your declines are in line with predictions, or if something might be going wrong and traffic is declining more than it should.
  • Include a graph with an update to your boss or client of what’s coming in advance, so they know you aren’t just making excuses after the fact.

Want to skip the info and just click a few buttons? 

While we’ll be going through running the code to forecast your web traffic and what each of the sections does, you can skip this and jump right to the Colab here if you aren’t interested in knowing what’s going on and how to make adjustments.

For those who want to run the code locally and be able to edit the hyperparameters (a fancy name for some of the variables that do important things and generally have one value for a complete run of a model) let’s go!

Important note before you begin: The further ahead you ask it to predict, the wider the gap between the low and high estimates gets as the model becomes “less sure of itself.”

How to forecast your Google Analytics traffic

We’ll be using two systems to accomplish our goal:

  1. UA Query Explorer: In this example, we’re going to use Universal Analytics for our forecasting. I will adjust the code in the Colab in about a year to GA4, but because it needs a year or more of data to really do the job, using UA, for now, makes the most sense and few people have GA4 data going back more than a year. UA Explorer is a tool that will quickly and easily generate the API URL that will pull our analytics for us.
  2. Facebook Prophet: Prophet is a forecasting model built and open-sourced by Facebook. It includes a lot of great built-in features, such as the ability to import holidays. It’s what’ll turn our analytics data into a forecast.

For those who wish to run locally, you can obviously do so, and the code provided will get the job done.

So, let’s dive in and get you predicting your future traffic!

1. Connect your instance

What this means is you’re “turning on” Google Colab so you can run scripts from it.

2. Import the needed libraries

The next thing we need to do is to import the libraries we need to make all this work. 

They are:

  • pandas – a Python library for data manipulation (to help us work with time-series data structures).
  • numpy – needed to work with arrays (like our data and sessions array).
  • matplotlib – we’ll be using this to create some visualizations.
  • json – used to work with JSON data.
  • requests – used to make HTTP requests (like pulling analytics data).
  • fbprophet – used for time series forecasting.
  • pystan – used to update probabilities. Like the probability of the traffic being X on a date in the future.

To run is all you need to do is click the play button.

You’ll see a bunch of downloads start and the play button turn into a spinning icon indicating it’s working, and when they’re done downloading and installing the play button with re-appear.

3. Sign up for Google Analytics demos & tools

You need to log in using the Google account tied to the analytics you want to access.

4. Configure the analytics you’re pulling

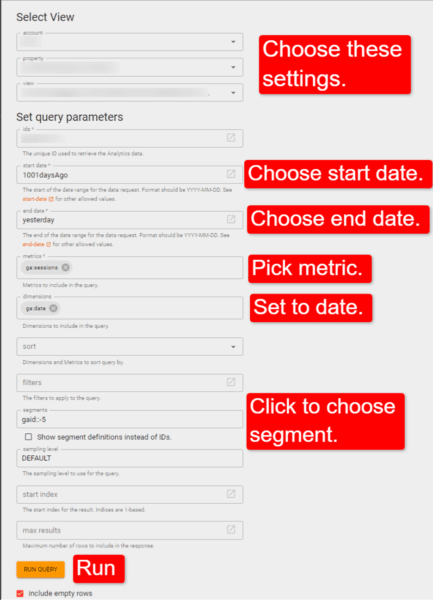
Next you need to select the account, property and view you want to pull your traffic data from.

Where it notes to pick a metric, you can pick from many of your traffic metrics depending on what you want to know. Examples might be:

  • Sessions (the one I use most)
  • Visitors
  • Unique visitors
  • Pageviews

Additionally, when you click the “segments” field a list of all the segments for the property (including custom segments) will display so you can select what traffic you want to look at.

After you’ve run the query just copy the API request URL:

5. Import analytics into the colab

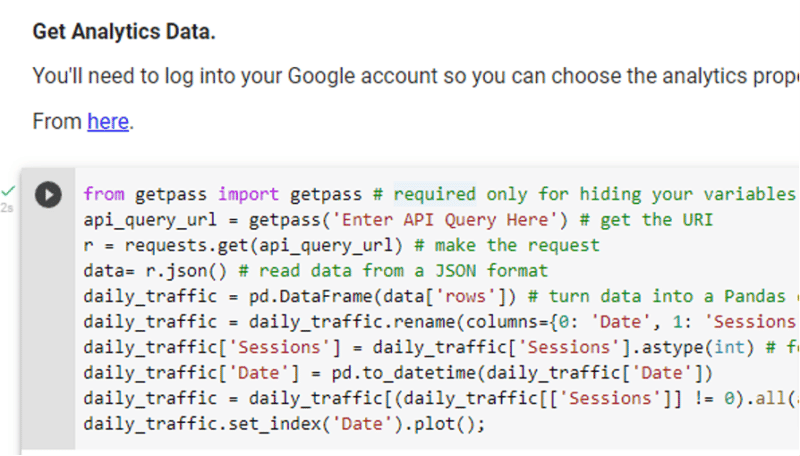
Click the play button in the next cell:

You will be asked to enter the API query you just copied:

Paste it in and hit “Enter.”

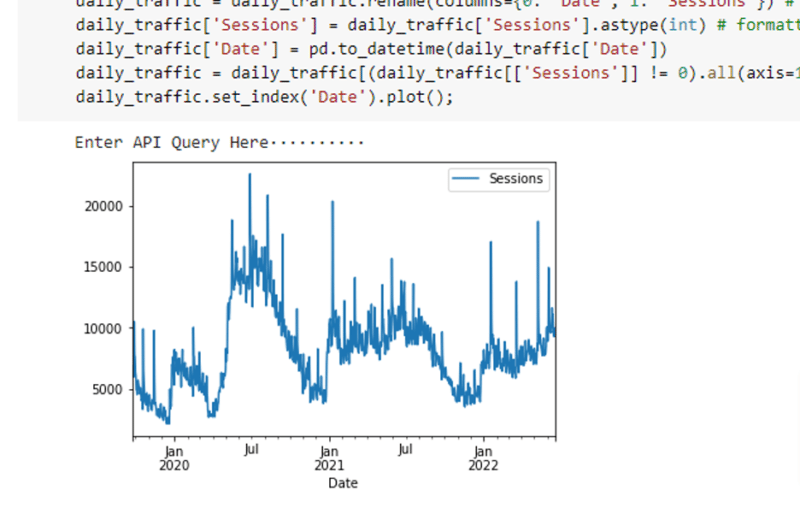
You should be presented with a graph of the traffic over the data range you selected:

6. Formatting

The next cell just changes the column headings to what Facebook Prophet expects.

7. (Optional) Save

This step is completely unnecessary if you don’t plan on referencing back to the traffic numbers or forecasted numbers. I personally find it handy, but some won’t. 

The first thing you’ll track is simply the traffic numbers (same as you could export).

I promise it gets more interesting.

8. Adding holidays

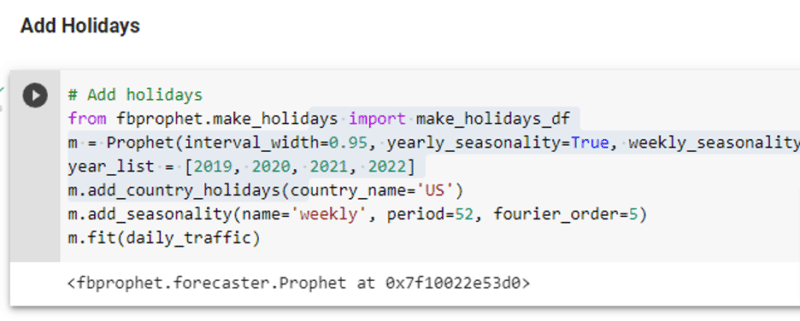
The next step is to add holidays and to determine how seasonality is considered. There are some options and ways you can tweak things, or you can run it as is.

The decisions you need to make are:

  • What years do you want to pull the holidays for?
  • What country do you want to pull the holidays for?

Additionally, you’ll notice the line:

m = Prophet(interval_width=0.95, yearly_seasonality=True, weekly_seasonality=True, daily_seasonality=False, seasonality_mode = "additive", changepoint_range = 0.85)

You can change any of the parameters to suit your needs, though these settings should work decently in most scenario:

  • interval_width: This is how uncertain we’re willing to let the model be. Set to 0.95 it means that when training, 95% of all points must fit within the model. Set it too low, and it follows general trends but isn’t overly accurate. Set too high and it chases too many outliers and becomes inaccurate in that direction.
  • yearly_seasonality: Monitors and responds to yearly trends.
  • weekly_seasonality: Monitors and responds to weekly trends.
  • daily_seasonality: Monitors and responds to daily trends.
  • seasonality_mode: Set to either “additive” or “multiplicative”. Additive (the default) results in the magnitude of change being constant. You’d use this in most case to deal with things like holiday traffic spikes where the percentage increase vs pre-Black Friday is more-or-less steady. Multiplicative is used in scenario where there are growing surges. For example, in a growing town that sees an additional increase each year. Not only is there growth, but that growth gets larger with each interval.
  • changepoint_range: A change point are points where the traffic changes significantly. By default the changepoint 

This is a tip-of-the-iceberg scenario. There are other parameters you can review and apply as you feel so inspired. Details on them are available here.

I’ve set things here to what seems to work well for me in most (but not all cases). 

Yearly and monthly seasonality impact most businesses. Daily, not so much.

9. Crunch the numbers

Thankfully you don’t have to do it. 

Simply click the run button.

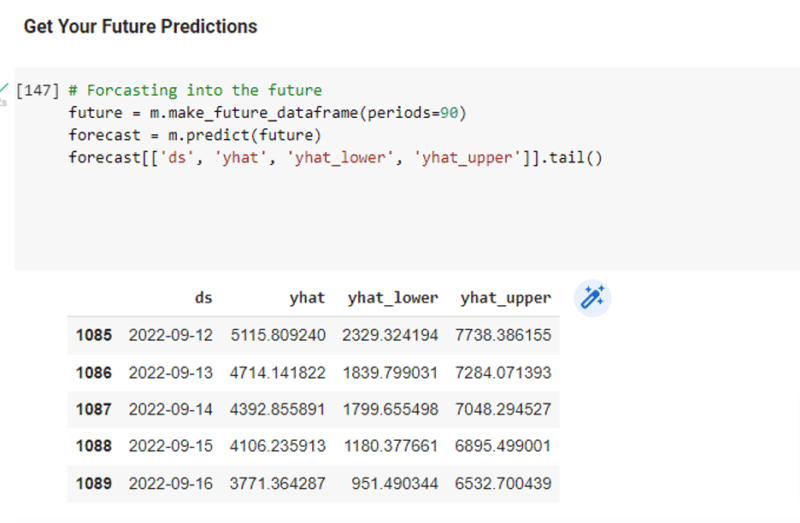
And you’ll soon see:

Not all the rows or columns are showing. If they were, what you’d see is:

  • The highest number the model predicts likely (yhat_upper).
  • The lowest (yhat_lower).
  • The predicted value (yhat).

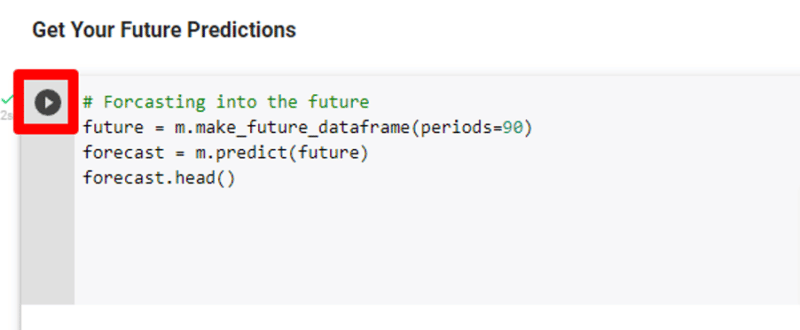
Importantly, you’ll see “periods=90” in the code above. That is the number of days I’m going to get predictions for.

I’ve found 90 works decently. After that, the range gets pretty large between high and low but can be interesting to look at.

10. (Optional) Save predictions

This is an optional step for those who would like to save their predicted values, or use them to test against different parameter values (those discussed in step eight above).

Once run, you’ll just click the link:

Which takes you to:

Each time you run it your numbers and results will be stored and can be easily accessed at a future time to compare with different runs.

It will also give you the numbers to reference if you’re ever asked for a predicted value for a specific day.

11. The magic

Hit the run bottom and you get what you’ve likely come here to get.

Optional

I’ve added an extra Insights section. It simply displays the impact of some of the areas we’ve been discussing above.

You can see in the top chart, where the different change points are. Further down you get insights into how the different seasonal trends are impacting the predictions, etc.

Closing

I’ve always looked for ways to predict in advance what’s coming my way.

It’s always better to show your boss or client that a slowdown is expected a week before it happens rather than try to explain it after the fact. 

Additionally, this insight can also help you plan your strategy.

Your work may be different when in your peak traffic points, than it is when you’re in a lull. You can look back over your analytics trends month-by-month, year-by-year and try to piece it together – or just let machines do what machines do best.

Just a reminder, if you got to the bottom and wanted to get to the Colab to run this yourself, you’ll find it here.

The post Forecasting web traffic using Google Analytics and Facebook Prophet appeared first on Search Engine Land.


from Search Engine Land https://ift.tt/ysX7fql
via

3 ways to dominate with Google Auction Insights and search intelligence

While marketers have overcome many challenges in recent years, sadly, the second half of 2022 is poised to be very different from the first. Unprecedented macroeconomic factors such as high inflation, food and energy costs and the war in Ukraine are impacting our business.

Hiring is starting to slow down, and the pressure is on. There is a good chance that you’ll probably be asked to do more with less, as budgets may be prioritized and cut in certain areas. 

On the flip side, Google Search ad spend continues to rise. It’s the channel that is always on, the channel with the highest conversion rate and the channel that won’t go away.

This part of the marketing mix is reliable and constant, but are the campaigns delivering success? Are they contributing to sales? Contributing to leads?

Auction Insights is a powerful tool we’ve all come to use for understanding campaign performance against competitors. Search intelligence adds another layer of granularity to ensure you’re one step ahead of your competition.  

Join Ashley Fletcher, VP of Marketing at Adthena, in his informative SMX Advanced session to explore three easy search intelligence tactics that will help you dominate your competitive landscape. He also shares use-cases from L’Oreal and Avanti West Coast trains.  

After this session, you’ll be able to save time with competitive monitoring, track performance over time and see your competitor’s spend and ad copy. The presentation will help you use data to make better ad campaign decisions and dig into search intelligence to understand why certain ads are successful to ultimately dominate the competition.

The post 3 ways to dominate with Google Auction Insights and search intelligence appeared first on Search Engine Land.


from Search Engine Land https://ift.tt/F3a2Jdc
via

Wednesday 29 June 2022

Webinar: Work smarter, not harder, to give customers what they want

Personalizing your marketing campaigns for one customer is easy, but how about one hundred or thousands of customers across multiple marketing channels?

Work smarter, not harder, by using artificial intelligence (AI) as part of your martech stack and giving your customers the unique experiences they crave.

Register today for “Use Data to Create Next-Level Customer Experiences at Scale,” presented by MoEngage.

The post Webinar: Work smarter, not harder, to give customers what they want appeared first on Search Engine Land.


from Search Engine Land https://ift.tt/5eTMjuW
via

Warby Parker dodges 1-800 Contacts lawsuit over search results, website

Online retailer Warby Parker was sued by 1-800 Contacts over it’s use of the latters branded keywords to redirect searchers to the Warby Parker online store. The case was dismissed by a Manhattan federal judge saying that Warby Parkers’ ads are unlikely to confuse potential customers.

The decision. Judge Kevin Castel argued against 1-800 Contacts saying that customers are unlikely to think that they’re buying from 1-800 Contacts when they click on a Warby Parker ad. Castel also said the companies’ trademarks were too dissimilar to confuse contact-lens buyers, who are likely to pay close attention to what they are purchasing and noted that Warby Parker’s name is clearly displayed in the search results and on its website.

Castel added that prospective customers will take the time to figure out that the search results link to Warby Parkers website, and will therefore discern that they are buying from contacts from Warby Parkers website. 

1-800 Contacts response. A spokesperson for 1-800 Contacts said after the ruling that the decision by the judge was “inconsistent with several well-established legal principles,” and that the company is “evaluating appropriate next steps, including whether to appeal.”

Sounds familiar. Earlier this year we reported on an attempt by Edible Arrangements to sue Google over theft, conversion, and racketeering. Edible Arrangements lost that lawsuit, but this was not the first case courts heard over trademark and copy issues. 

In my own Google search, I was unable to mimic the results that this suit was based on and didn’t find any Warby Parker ads initially. You can read the article and ruling from Reuters here.

Why we care. The dismissal of this case against Warby Parker should concern advertisers who are competing for branded keywords. If you’re facing a similar issue, you can visit the Google trademark help document, but it can be a painstakingly long, and temporary band-aid for a much bigger issue. On the contrary, if you’re using another brand’s keywords in your ad strategy, be careful, as you could see yourself in hot water. 

The post Warby Parker dodges 1-800 Contacts lawsuit over search results, website appeared first on Search Engine Land.


from Search Engine Land https://ift.tt/DJo1w20
via

5 ways to get PPC and SEO working together

Causes of friction between SEO and PPC often occur because we tend to use different sources of truth for each channel and build silos of communication between teams.

The main core areas of friction? Usually:

  • Reporting 
  • Landing pages
  • Budget

Here are five ways you can get your PPC and SEO campaigns working together.

Tip 1: Collaborate on first-party data readiness

All digital marketing campaigns need to account for first-party data.

Understanding whether your brand is compliant requires input from both your SEO and PPC teams. 

If you rely heavily on remarketing campaigns (either because you’re in an expensive industry or the customer journey naturally takes multiple steps), you may find yourself increasingly reliant on native audiences.

While some of these audiences can be powerful, most of them underperform against audiences based on brand-tracked activity. 

Analytics audience segments can be a powerful way around fluctuating quality.

These audience segments still require consent and the new global site tag. Make sure your tag is updated to GA4. 

As you set up cookie consent, it’s important that the module follows cumulative layout shift (CLS) rules. As a general rule, modules on the bottom of the page tend to do better as they don’t distract from the user’s purchasing journey, and carry less CLS risk. 

Make sure that first-party data collected is protected (either hashed and synced through tools, or immediately deleted once it’s been uploaded into ad accounts).

Collaborate with your SEO team’s content campaigns to ensure there are engaging hooks to create consensual conversations.  

A final note about analytics

One big drawback in the current roll-out of GA4 and conversion modeling is that advertisers need to choose between using analytics as their source of truth versus harnessing the power of enhanced conversions.

Enhanced conversions require using native Google conversion tracking. While enhanced conversion tracking will give you a better idea of what paid campaigns are doing, the numbers will always be off from what your SEO team reports.

In the interest of trust and data continuity, it may make sense to take the “hit” on PPC-reported numbers so long as the overall metrics point to positive ROAS.

Going with enhanced conversions means being ok that reports will be different and all parties need to be ok with that. 

Tip 2: Acknowledge and adapt based on domain structure choices

There are three ways to set up brand URLs:

  • One domain for everything (including international).
  • Subdomains for various initiatives.
  • Vanity domains and country domains.

Regardless of what path you take, PPC-specific pages need to be noindex/nofollow and allow for the adbot to access them so they can contribute to quality score. 

It’s rare that non-ecommerce brands will be served better by keeping everything on the same domain. That’s because there are strategic elements of a well SEO’d site that can run counter to PPC:

  • SEO doesn’t want duplicate content, and PPC benefits from testing templates.
  • SEO benefits from a robust navigation bar, while PPC does better with limited choices for user action.
  • SEO might need to redirect a page, which will cause the ad to get disapproved (three strikes in a 90-day period causes the ad account to get suspended).

These pitfalls are easily mitigated by having subdomains that can still benefit the main domain, without forcing creative or technical compromises between the SEO and PPC teams.

Additionally, a subdomain will allow you to keep the same analytics property and branding continuity.

If you are forced to use the same landing page for PPC and organic traffic, make sure that any redirects are communicated at least three to five days before it will happen. This will give the PPC team time to adjust the creative so you’re not wasting money sending traffic to a broken page until Google disapproves the ad. 

Conveying inventory is also really important for both PPC and SEO.

If your product is constantly out of stock, it will eventually get penalized by the search engines. Make sure all campaigns are made aware of inventory issues so they can exclude products from paid campaigns, as well as apply the out-of-stock schema to the organic page.   

Tip 3: Bring transactional intent & CRO to all pages

SEO often gets unfairly pigeonholed as the “research” channel, while PPC is often accountable exclusively for transactions.

While there are some valid reasons to think about traffic in that way, there are lessons in building trust and enabling transactions each can learn from the other. 

For example, while it’s true that PPC pages lean towards less content, there still needs to be options to understand the product/service. This content (written or in video format) should be below the fold, keeping the path to conversion clear.

On a similar note, SEO requires rich and authoritative content to rank well. Yet if the path to conversion is buried (or not there at all), the traffic will be all fluff. 

On first pass, you’d think this was a well-crafted page on the organic site. Yet this was actually a special PPC version of the page. 

Ironically, the SEO version of the page has clearer paths to conversion. If you’re going to take the time to make a PPC page, make sure it honors the rules of PPC. 

This page gives the user enough context to know what they’re getting into as well as clear paths to conversion.

If the user wants more info, they can get it, but aren’t overwhelmed. They are also given the option to fill out a multi-step form that builds engagement with the brand.

The organic site is just as clean and easy to navigate as the paid variant. The CTAs are easy to identify and the path to conversion remains uninterrupted. 

Tip 4: Use search query reports to inform campaigns

One of the best ways to get PPC and SEO working together is data sharing on search queries.

You’re already paying for the search data from the search terms report. Sharing that data, along with what’s converting and what’s not will help content teams know where to invest. 

Yet an easily missed opportunity is sharing the search terms from in-site search and search console.

Understanding what existing customers want and how they think will help prioritize keyword variants. 

Both channels should be sharing search term data so brands are able to get insights on the viability of content and auction prices. 

Set up automatic report sharing on at least a quarterly basis so all digital channels are talking to each other. 

Tip 5: Build in time to talk to each other 

This may seem like a silly and trite suggestion, but the amount of good that can come from getting face time with your counterpart is immeasurable.

Whether it’s a 10-15 minute connect at the beginning of the week or a monthly collaboration session, taking the time to connect on the innovations and challenges in each domain will ensure the other can be prepared to mitigate or enhance.

If you’re an agency and your counterpart works for another agency, ask for joint meetings with the client or separately.

Showing your commitment to the brand’s success and collaborative attitude will go miles for client retention and ensure your great work isn’t accidentally countered. 

PPC and SEO don’t need to be at odds

Overcome the friction through collaboration and owning where one can mitigate weaknesses and amplify profit. 

The post 5 ways to get PPC and SEO working together appeared first on Search Engine Land.


from Search Engine Land https://ift.tt/1bmdSD9
via

Processes, visibility and optimization: The keys to digital marketing transformation

As digital marketers face a rapidly growing market and higher competition, the structure and effectiveness of paid advertising campaigns become more complex. Optimization, visibility and improving processes matter now more than ever.

But, it can be easy to lose visibility over what needs to be done and how those campaigns perform. This can lead to subpar results and a lack of understanding of how to improve your next campaigns. 

In this informative SMX Advanced session, Nadiia Sharipova from Wrike, now part of Citrix, addresses three keys to digital marketing transformation:

  1. Why optimization and visibility matter
  2. How to reduce your competition in key areas
  3. Critical processes that help improve CRO

Join the session to learn better visibility and workflow for your search engine initiatives, how companies like Hootsuite optimized their workflows to reduce complexity and the essential tools and strategies you need to do your best work. 

After watching the presentation, you’ll be able to:

  • Identify pitfalls negatively impacting your search campaigns 
  • Discover solutions for establishing better visibility over assets and results 
  • Streamline SEM/PPC campaign workflows and optimize collaboration

The post Processes, visibility and optimization: The keys to digital marketing transformation appeared first on Search Engine Land.


from Search Engine Land https://ift.tt/ws1b4q7
via

Tuesday 28 June 2022

SimilarWeb & Rank Ranger talk acquisition, SEO challenges, opportunities

Web analytics company SimilarWeb acquired rank tracking and monitoring tool Rank Ranger last month. Terms of the deal, announced on May 16, were not revealed. 

I recently had a chance to conduct a Q&A with SimilarWeb VP, GM Digital Marketing Solutions Baruch Toledano, as well as Rank Ranger CEO and founder Shay Harel

Toledano and Harel discussed what the acquisition means for both companies and their customers. They also discuss some of the biggest challenges and opportunities in SEO right now. Here are the highlights. 

SimilarWeb

The company, founded in 2007, has more than 1,000 employees. It also has more than 2,500 customers around the world, from startups to Fortune 500 companies, including Adidas, Adobe, Booking.com, DHL, Google, MGM and Pepsico.

According to Toledano, SimilarWeb’s mission is to:

  • “Empower digital growth by providing decision-makers at all levels with 360° visibility into the digital world. We provide granular insights for any website, mobile app, industry and market globally.”

Why did SimilarWeb acquire RankRanger? Toledano said:

  • “Rank Ranger provides SEO managers with search term tracking and monitoring. The fidelity of their data and ability to identify ongoing SERP changes has been instrumental to many organic search marketers. We believe that by combining SimilarWeb traffic analysis features and our datasets with ongoing rank performance, SEO managers will have a complete set of insights to design, measure, report and improve their marketing campaigns.  From planning to on-going monitoring to actionable insights to improving rank positioning.”

This acquisition provides many SimilarWeb customers with a comprehensive view into their business decisions, Toledano said.

  • “For marketers, this means tying campaign strategy research activities with ongoing performance and improvements.  It means expanded topic ideation and tracking of content visibility on search. For other roles leveraging our solution, it provides additional reporting granularity, allowing for close monitoring of companies, products, investments, compliance and competitive insights. For example, consideration for potential and ongoing investments and their digital competitors’ presence; Brand and their affiliates’ compliance and monitoring for marketing the brand’s products; close inspection of trends as they emerge in search or other channels and many other use cases.”

What is Toledano’s favorite thing about Rank Ranger?

  • “By far, the ranking granularity and all associated reports. Also, I like the fidelity they have for some of the unique engines like Google For Jobs that allows marketers to optimize across specialty search sites.”

This was the second acquisition for SimilarWeb within six months. In November, SimilarWeb acquired Embee Mobile, a mobile insights provider. That acquisition was meant to strengthen its mobile app intelligence offering.

Rank Ranger

The company, founded in 2009, has “hundreds” of customers (the company declined to be more specific), including H&M, Reckitt and Motley Fool.

All of Rank Ranger’s employees (more than a dozen developers and SEO specialists) now work out of SimilarWeb’s Tel Aviv office. All that has really changed is that Rank Ranger is now a SimilarWeb-owned company.

Harel views SimilarWeb as a complementary software to Rank Ranger, which allows for new opportunities to develop new SEO tools and analytics (e.g., traffic analysis, competitor intelligence, advanced reporting).

Here’s how Harel summed up what Rank Ranger does:

  • “Rank Ranger is an all-in-one SEO and digital marketing tool designed to give businesses a strategic advantage through advanced reporting and analytics.”

For many startups, the goal is to get acquired. But that was never the goal for Rank Ranger, Harel said: 

  • “We have worked closely with SimilarWeb over the past few years, and the synergies were a fit, and at some point, we saw a great opportunity.”

I asked Harel what he remembered most about the early days of the company. At the time, SEO was still in its early stages and there was a growing demand from marketers for tools that helped them perform daily and monthly tasks: 

  • “It was very exciting to work with digital marketing agencies, understand their needs and build tools for our early clients that could help them with automation of their daily workflows. The SEO space has been evolving so quickly every year and we had to adapt and constantly innovate with new metrics and insights to keep up with the rapid pace of change.”

Harel also shared a couple of highlights from his time at Rank Ranger: 

  • “On the technical side, our Insight Graph innovation has become a best-in-class reporting tool, having a blend of sources all-in-one marketing report. As for the business, the most exciting moment in the early days was when we closed Booking.com as a customer in a short timeframe. It was a challenging case of a custom solution where we excelled in our efforts to come up with a solution, which led to a new offering concept and many new businesses resulting from that use case.”

So what is Harel’s favorite thing about SimilarWeb?

  • “Without a doubt, the keyword freshness and database is amazing and very different from “our” SEO world. Normal SEO tools are building keyword datasets based on Keyword Planner, Google Suggest/Related, Search Console, etc. These tools, by nature, have so much noise, it’s like an ocean that you need to invest so much time on research to get value. With SimilarWeb’s clickstream data, you get a clean dataset that is also up to date, that can be segmented from a very different angle. I believe that in the coming years, it will become the best common practice used by SEOs.”

The biggest SEO challenges and opportunities right now

According to Toldedano:

  • “Aligning and telling this story in the design of every marketing campaign is their biggest challenge but also presents the biggest opportunity.  In addition, bringing other corporate roles outside of marketing to benefit from SEO insights, can drive better business decisions and promote its prominence in the organization.”

He added that challenges are opportunities where SEO can become a pivotal role within the marketing team:

  • “SEOs can help align cross-channel marketing activities to deliver the most impact with other marketing roles combining paid and organic activities.  SEOs can empower CMOs with relevant insights when crafting mixed marketing strategies, particularly for the mid and long-term traffic and brand awareness goals.

Because SEO sits at the junction between creative, analytical and technical disciplines of marketing, it provides the best representation of the voice of customers and what it means to each of these disciplines, Toldedano said.  

  • “To drive stronger alignment of marketing campaigns activities, the customer needs and expressions on organic search are the most genuine and long-lasting form of marketing that typically deliver the most impactful result.”  

Keeping up with Google is the biggest challenge, according to Harel. More specifically, changes to SERP features and the display of organic results.

  • “These changes are creating new opportunities and invite more competition on keywords and obviously demotes monopolies on certain keyword spaces. For example, in 2015 there were 10 organic results and one Featured Snippet = a total of 11 domains competing. Today you have 10 organic results, a block of related questions, a featured snippet and new boxes that can take the number of domains to 20 and more! That’s a lot of competition on a single keyword.”

The post SimilarWeb & Rank Ranger talk acquisition, SEO challenges, opportunities appeared first on Search Engine Land.


from Search Engine Land https://ift.tt/wdKjan5
via

Webinar: Grow revenue streams through web accessibility and compliance

1 out of 4 people in the U.S. lives with some type of disability. Because consumers are online now more than in previous years, your clients’ websites must be accessible to everyone.

It’s not merely a matter of being compliant with the Americans with Disabilities Act (ADA) and Web Content Accessibility Guidelines (WCAG). It’s also good business—because web accessibility can deliver better results and enhance search engine optimization.

Join a panel of agency, compliance and disability leaders to hear more about how web accessibility can work for your agency and your clients.

Register today for “Agencies: Grow Revenue Streams Through Web Accessibility & Compliance,” presented by accessiBe.

The post Webinar: Grow revenue streams through web accessibility and compliance appeared first on Search Engine Land.


from Search Engine Land https://ift.tt/82vVaZ5
via

Facebook testing new sidebar, channels for groups

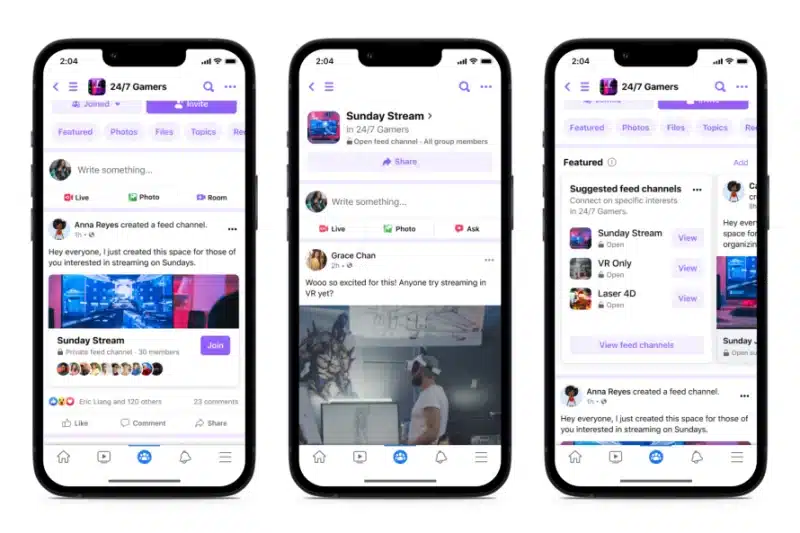
Facebook is testing a new sidebar that helps users find groups quicker and easier. The sidebar lists your groups and their latest activity like posts or chats. You can also pin your favorite groups so you can access them quicker, and even create your own.

The case for groups. Facebook groups aren’t new. Groups are used to get users with similar interests, and hobbies together, in a place where they can collaborate, communicate, sell, or meet in person. This reorganization doesn’t change the functionality of groups or how they work, but reorganizes them within the Facebook platform and offers a few new features.

How groups are organized. In the new sidebar, you’ll be able to easily see a menu that takes you to links for events, shops, chats, or other channels within the group. 

Within their groups, admins can create individual channels to allow smaller, more casual interactions. This is meant to drive deeper discussions and organize the group around sub-topics of interests and demographics. 

New group features

Community chat. Message and collaborate with other group members in private, smaller channels based on a sub-topic or interest.

Community audio. This allows admins and members to hold audio conversations in real-time.

Community feed. Just like with a normal Facebook feed, the community feeds allow you to browse activity within your selected channel. 

Launch date TBD. There isn’t any information on when these new features will be launched to the public fully. But you can read the announcement here.

Why we care. Businesses with a large Facebook presence can take advantage of these new features and create groups around their product or service. There’s no guarantee they’ll result in any measurable success, but creating a community around their brand may be a way to keep people engaged.  

The post Facebook testing new sidebar, channels for groups appeared first on Search Engine Land.


from Search Engine Land https://ift.tt/qm74D6y
via