When it comes to creating reports for your data, sometimes a pre-built dashboard, table, or template will do the trick. But what happens when your current tool doesn’t have a pre-built report that meets your needs or includes the metrics and dimensions you want to use?
Well, that’s when a custom reporting tool comes in handy.
What are custom reporting tools?
Custom reporting tools provide the ability to create personalized and unique (or customized) reports for your data. In addition to selecting the data you’ll display in your report, you can also customize a report’s metrics, dimensions, appearance, and more.
There are a number of custom reporting tools available today including options that come with other perks like no necessary coding, easy installation, different pricing plans, support, and integrations (e.g. for data analysis and one-click sharing).
Many custom reporting tools, like HubSpot, often come with pre-built templates and dashboards as well for instances in which you don’t need or want to customize your report.
Here are 9 custom reporting tools to help get you started.
1. HubSpot Marketing Analytics Software
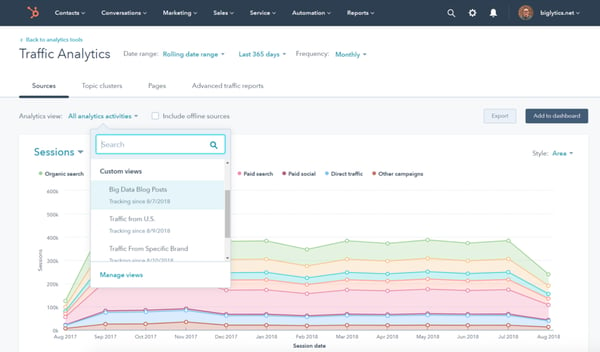
HubSpot helps marketers surface a combination of customer insights and data to better understand what’s working and what’s not among target audience members. All of these insights and reports are available at your fingertips — alongside your CRM — without SQL.
The custom report builder offers access to all of your data in a single location without the need for spreadsheets. Use the custom builder to organize all of your business data including contact, company, deal, marketing email, landing page, and blog engagement data.
Other Unique Features:
- Use custom objects to capture your unique business data, create new segments, build custom reports, campaigns, and workflows.
- Build custom, shareable dashboards to see all of your metrics on one screen with a no-code, drag-and-drop editor.
- Report on data that’s unique to your business such as product usage or inventory data.
- Use behavioral events to track custom interactions that are unique to your business and indicate when a customer is ready to take the next step in the buyer’s journey (then trigger or schedule the next touchpoint for after that event is completed).
- Connect every customer interaction to a contact in your database and the associated revenue generated by using the revenue attribution reporting feature.
- Monitor the effectiveness of your marketing and sales efforts within the account based marketing (ABM) dashboard and then adjust your playbook accordingly to reach your highest-value accounts.
2. Demand Sage
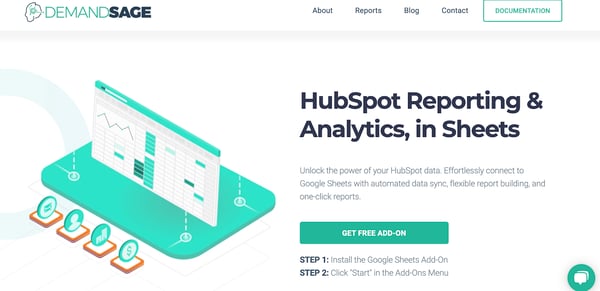
With Demand Sage, easily move your HubSpot reporting and analytics data into Google Sheets. The tool offers custom and automated — with automatic data sync and pre-built dashboards and templates — reports.
Other Unique Features:
- Get very specific with your data by creating reports that are record-level.
- View your data any way you’d like using Demand Sage’s no-code analytics and table builder.
- Install the free Demand Sage add-on, click “Start” in the add-ons menu, and immediately begin creating custom reports.
- Integrate Demand Sage with your HubSpot CRM and Marketing Software.
3. Cyfe
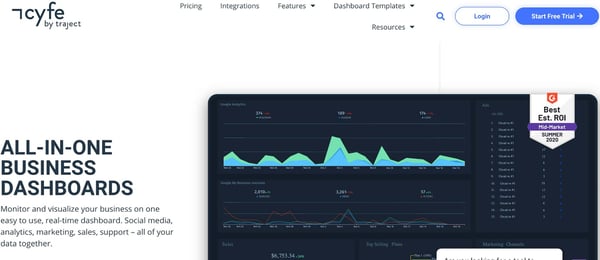
Cyfe is a tool for making fully-customized business dashboards to monitor, display, and analyze your data. The tool is described as an all-in-one dashboard because you can monitor all of your company’s data including (but not limited to) sales, web analytics, social media, and support.
Other Unique Features:
- Create benchmarks to measure your progress against your business objectives. Then, receive alerts from Cyfe when specific benchmarks are met (via email or SMS).
- Customize all aspects of your report including the domain name, background, logo, and colors.
- View data from multiple sources (e.g. Google, Facebook, Mailchimp) by tapping into Cyfe’s app ecosystem of 1,500+ apps.
- Customize dashboards with data from your SQL database.
- Integrate Cyfe with your HubSpot CRM, Marketing Software, and Sales Software.
4. Supermetrics
With SuperMetrics, you can easily move your marketing and sales data into Google Sheets, Microsoft Excel, Google Data Studio, BigQuery, API, Snowflake, and Uploader. Once you bring your data into any of these products, fully customize your reports with the Supermetrics templates.
Other Unique Features:
- Display and manage all of your marketing data in a central location.
- Organize and filter your data in Supermetrics to analyze what’s working and what needs improvement.
- Automate marketing reporting and data transfers to save you time.
- Integrate Supermetrics with your HubSpot Marketing Software.
5. Domo
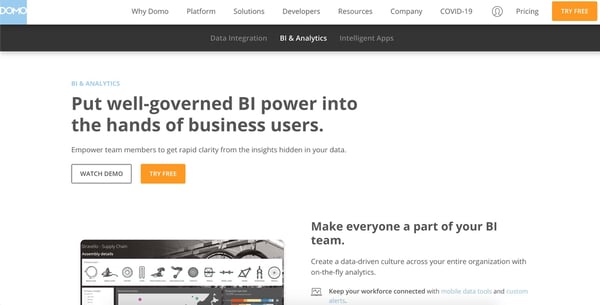
Domo is a business cloud that allows you to easily integrate and visualize your data as well as use (or create) intelligent apps to tailor reports in a way that makes them valuable to your team.
Your interactive and customizable reports are updated in real-time. Based on the type of data you bring into Domo, the tool will recommend certain visualizations it thinks are best-suited to display your information.
Other Unique Features:
- Customize your reports by annotating charts, adding governance tools for your team, and refining the data points that are most important to you.
- Bring all of your marketing and sales data together to create insights and action plans based on the real-time information in your dashboards.
- Determine how the various aspects of your dashboard interact with custom links/ filters.
- Integrate Domo with your HubSpot CRM.
6. Dear Lucy
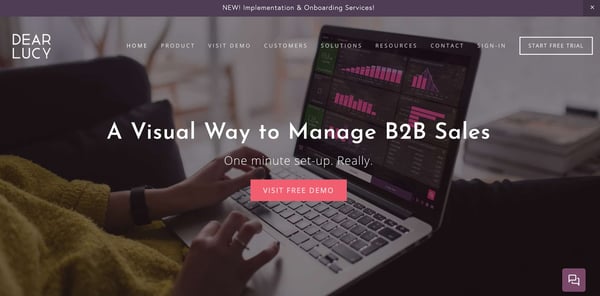
Dear Lucy is a dashboard for B2B sales. Choose the metrics that matter most to your team and bring them into a single dashboard to display your data. On your dashboard, show pipeline-based or activity-based forecasts so you know what to expect in relation to the goals you set.
Other Unique Features:
- Customize your entire dashboard with the drag-and-drop editor to show the metrics and data you care about most.
- Use the red and green light feature to be notified when your team is on target or is falling behind so you can make necessary adjustments.
- Define unique goals for things like activities, revenue, offer base, and hit rate to compare your performance versus targets.
- Customize the way you filter your data for your reports (e.g. by customer type) so it’s tailored to your team and goals.
- Integrate Dear Lucy with your HubSpot CRM, Marketing Software, and Sales Software.
7. Analytics Amplifier
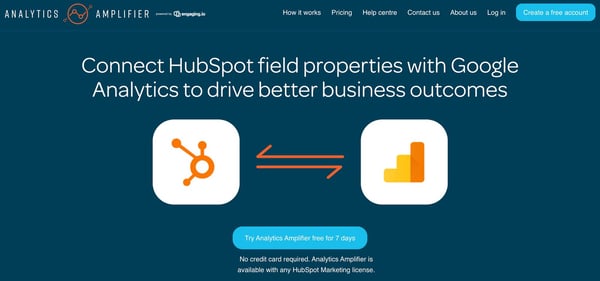
Bring your HubSpot contact data into Google Analytics with ease using Analytics Amplifier. Add HubSpot field properties or custom behaviors (e.g. lifecycle stage, deals won, email unsubscribes) to Google Analytics for viewing. This tool is meant to help you optimize your business paths and drive business intelligence by offering access to data about your contacts in Google Analytics.
Other Unique Features:
- View your HubSpot object-level data metrics including lifecycle set, deals won, persona set, lead score, number of associated deals, lead status, email unsubscribes, and NPS rating.
- Create and generate rich, custom reports in Google Analytics using contact data from HubSpot to understand how your contacts and customers interact and engage with your business.
- Use insights derived from your reports to help you reach people who look like members of your target audience.
- Integrate Analytics Amplifier with your HubSpot CRM, Marketing Software, and CMS.
8. Ultimate Data Export

Ultimate Data Export, by Datawarehouse.io, allows you to export all of your data — such as contacts, deals, web analytics, tickets, and emails — to Excel. You can also back up your data as well as restore, query, sync, integrate, analyze, and share it. This tool is ideal for users who want to move data out of HubSpot and into a platform of choice, all at a low cost.
Other Unique Features:
- Export all data from your HubSpot system (e.g. contacts, companies, deals/ deal history, web analytics, owners, campaigns, engagements, emails, products, tickets, forms, pipelines, and more) and view it in a custom report in Excel.
- Connect to business intelligence tools like Tabelau and PowerBI for deep insights into your data.
- Integrate Ultimate Data Export with your HubSpot CRM, Marketing Software, and Sales Software.
9. Google Analytics
Google Analytics has a custom report feature that allows you to choose the dimensions (e.g. city) and metrics (e.g. page views) for your report as well as decide how that data will be displayed. If you’re a Google/ Google Analytics user, or use a reporting tool with a Google Analytics integration, custom reports are easily accessible to you.
Other Unique Features:
- Export and share custom reports in seconds.
- Choose from a list of unique dimensions and metrics for your custom reports.
- Create categories to organize your custom reports into groups for easy access.
- Use the Custom Tables feature to back up your custom reports if you’re an Analytics 360 user.
There are many custom reporting tools available today that have the power to help you uncover valuable insights and analyze all of your business’s data. So, while trying to determine the best option for your team, think about which types of data you want to dive deeper into, where you want to conduct reporting and analysis, and how you want to share and distribute that information.
from Marketing https://ift.tt/3mAwWOL
via
No comments:
Post a Comment